Asus ProArt OC GeForce RTX 4070 Ti vs Asus ROG STRIX OC EVA GeForce RTX 3080 12GB LHR
A side-by-side spec comparison of the Asus ProArt OC GeForce RTX 4070 Ti and the Asus ROG STRIX OC EVA GeForce RTX 3080 12GB LHR. We line up every specification, highlight the winner of each, and tally an overall verdict so you can decide which video card is right for your build.
| Specification | ||
|---|---|---|
| TDP | 285W | 150W |
| VRAM | 12 GB | 12 GB |
| Length | 300 mm | 318 mm |
| Chipset | GeForce RTX 4070 Ti | GeForce RTX 3080 12GB LHR |
| Video Outputs | HDMI 2.1, DisplayPort 2.1 | HDMI 2.1, DisplayPort 2.1 |
| VRAM Type | GDDR6X | GDDR6X |
| Base Clock | 2310 MHz | 1260 MHz |
| Boost Clock | 2760 MHz | 1890 MHz |
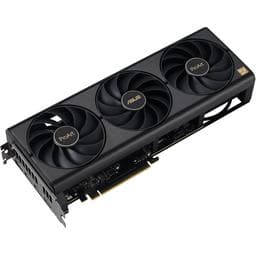

Asus ProArt OC GeForce RTX 4070 Ti
3
specs won
Asus ROG STRIX OC EVA GeForce RTX 3080 12GB LHR
1
spec won
As an Amazon Associate, PlanMyPC earns from qualifying purchases made through links on this page.
Real Gaming Performance: RTX 4070 TI vs RTX 3080
We compared real benchmark frame rates for the RTX 4070 TI and RTX 3080 across 4 games. The RTX 4070 TI comes out ahead, winning 3 of 4 games with an average of 168 FPS versus 125 FPS.
| Game | Resolution | RTX 4070 TI FPS | RTX 3080 FPS | Winner |
|---|---|---|---|---|
| Valorant | 1440p | 450 | 304 | RTX 4070 TI+48% |
| Hogwarts Legacy | 1440p | 95 | 83 | RTX 4070 TI+14% |
| Starfield | 1440p | 72 | 54 | RTX 4070 TI+33% |
| Baldur's Gate 3 | 4K | 55 | 57 | RTX 3080+4% |
Frame rates are averages from community-submitted benchmarks at the listed resolution. Actual performance varies with CPU, settings, and driver version.
Compare more parts
Add a third or fourth video card to this comparison, or build a side-by-side from scratch in the interactive compare tool.