Gigabyte GAMING OC GeForce RTX 3060 8GB vs Gigabyte GV-R68XT-16GC-B Radeon RX 6800 XT
A side-by-side spec comparison of the Gigabyte GAMING OC GeForce RTX 3060 8GB and the Gigabyte GV-R68XT-16GC-B Radeon RX 6800 XT. We line up every specification, highlight the winner of each, and tally an overall verdict so you can decide which video card is right for your build.
| Specification | ||
|---|---|---|
| TDP | 170W | 150W |
| VRAM | 8 GB | 16 GB |
| Length | 198 mm | 267 mm |
| Chipset | GeForce RTX 3060 8GB | Radeon RX 6800 XT |
| Video Outputs | HDMI 2.1, DisplayPort 2.1 | HDMI 2.1, DisplayPort 2.1 |
| VRAM Type | GDDR6X | GDDR6 |
| Base Clock | 1320 MHz | 1825 MHz |
| Boost Clock | 1807 MHz | 2250 MHz |
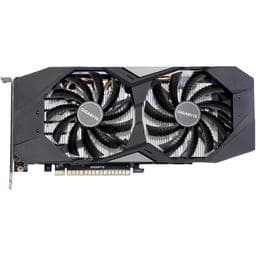

Gigabyte GAMING OC GeForce RTX 3060 8GB
0
specs won
Gigabyte GV-R68XT-16GC-B Radeon RX 6800 XT
4
specs won
Real Gaming Performance: RTX 3060 vs RX 6800 XT
We compared real benchmark frame rates for the RTX 3060 and RX 6800 XT across 48 games. The RX 6800 XT comes out ahead, winning 48 of 48 games with an average of 113 FPS versus 73 FPS.
| Game | Resolution | RTX 3060 FPS | RX 6800 XT FPS | Winner |
|---|---|---|---|---|
| League of Legends | 1440p | 280 | 350 | RX 6800 XT+25% |
| Valorant | 1440p | 230 | 310 | RX 6800 XT+35% |
| Rainbow Six Siege | 1440p | 170 | 270 | RX 6800 XT+59% |
| DOTA 2 | 1440p | 165 | 230 | RX 6800 XT+39% |
| EA Sports FC 25 | 1440p | 155 | 220 | RX 6800 XT+42% |
| Overwatch 2 | 1440p | 118 | 185 | RX 6800 XT+57% |
| NBA 2K25 | 1440p | 125 | 180 | RX 6800 XT+44% |
| Apex Legends | 1440p | 110 | 175 | RX 6800 XT+59% |
| Warframe | 1440p | 115 | 175 | RX 6800 XT+52% |
| PUBG: Battlegrounds | 1440p | 100 | 165 | RX 6800 XT+65% |
| Destiny 2 | 1440p | 92 | 150 | RX 6800 XT+63% |
| Grand Theft Auto V | 1440p | 100 | 150 | RX 6800 XT+50% |
| Diablo IV | 1440p | 75 | 120 | RX 6800 XT+60% |
| Delta Force | 1440p | 70 | 115 | RX 6800 XT+64% |
| Rust | 1440p | 68 | 110 | RX 6800 XT+62% |
| Ghost of Tsushima | 1440p | 64 | 108 | RX 6800 XT+69% |
| Call of Duty: Warzone | 1440p | 65 | 105 | RX 6800 XT+62% |
| Spider-Man Remastered | 1440p | 68 | 105 | RX 6800 XT+54% |
| Escape from Tarkov | 1440p | 70 | 105 | RX 6800 XT+50% |
| Marvel Rivals | 1440p | 65 | 105 | RX 6800 XT+62% |
| Baldur's Gate 3 | 1440p | 55 | 100 | RX 6800 XT+82% |
| The Witcher 3 | 1440p | 58 | 100 | RX 6800 XT+72% |
| God of War Ragnarök | 1440p | 58 | 100 | RX 6800 XT+72% |
| Path of Exile 2 | 1440p | 58 | 98 | RX 6800 XT+69% |
| Fortnite | 1440p | 58 | 98 | RX 6800 XT+69% |
| The Last of Us Part II | 1440p | 52 | 92 | RX 6800 XT+77% |
| Palworld | 1440p | 55 | 92 | RX 6800 XT+67% |
| Red Dead Redemption 2 | 1440p | 55 | 88 | RX 6800 XT+60% |
| Helldivers 2 | 1440p | 50 | 85 | RX 6800 XT+70% |
| Hogwarts Legacy | 1440p | 52 | 85 | RX 6800 XT+63% |
| Horizon Forbidden West | 1440p | 46 | 82 | RX 6800 XT+78% |
| Kingdom Come: Deliverance 2 | 1440p | 45 | 78 | RX 6800 XT+73% |
| Warhammer 40,000: Space Marine 2 | 1440p | 46 | 78 | RX 6800 XT+70% |
| Dragon Age: The Veilguard | 1440p | 42 | 72 | RX 6800 XT+71% |
| Final Fantasy VII Rebirth | 1440p | 40 | 72 | RX 6800 XT+80% |
| Indiana Jones and the Great Circle | 1440p | 36 | 70 | RX 6800 XT+94% |
| Elden Ring | 1440p | 58 | 60 | RX 6800 XT+3% |
| Microsoft Flight Simulator 2024 | 1440p | 38 | 60 | RX 6800 XT+58% |
| Genshin Impact | 1440p | 58 | 60 | RX 6800 XT+3% |
| Starfield | 1440p | 35 | 55 | RX 6800 XT+57% |
| Monster Hunter Wilds | 1440p | 31 | 54 | RX 6800 XT+74% |
| Dragon's Dogma 2 | 1440p | 32 | 52 | RX 6800 XT+63% |
| Star Wars Outlaws | 1440p | 28 | 50 | RX 6800 XT+79% |
| Silent Hill 2 | 1440p | 28 | 48 | RX 6800 XT+71% |
| Assassin's Creed Shadows | 1440p | 28 | 46 | RX 6800 XT+64% |
| Alan Wake 2 | 1440p | 28 | 45 | RX 6800 XT+61% |
| S.T.A.L.K.E.R. 2 | 1440p | 26 | 44 | RX 6800 XT+69% |
| Black Myth: Wukong | 1440p | 19 | 33 | RX 6800 XT+74% |
Frame rates are averages from community-submitted benchmarks at the listed resolution. Actual performance varies with CPU, settings, and driver version.
Compare more parts
Add a third or fourth video card to this comparison, or build a side-by-side from scratch in the interactive compare tool.