ASRock Steel Legend Radeon RX 9070 XT vs XFX RX-79TMBABF9 Radeon RX 7900 XT
A side-by-side spec comparison of the ASRock Steel Legend Radeon RX 9070 XT and the XFX RX-79TMBABF9 Radeon RX 7900 XT. We line up every specification and score the ones that matter most in this category — weighted, not a raw count of specs won — to reach an overall verdict so you can decide which video card is right for your build.
As an Amazon Associate, PlanMyPC earns from qualifying purchases. We may also earn from other stores linked here. How we make money
| Specification | 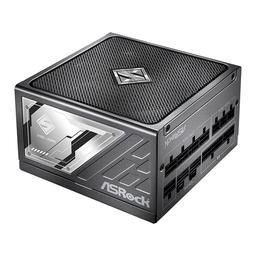 $969.99 Newegg price as of Oct 23, 04:02 UTCFaster in games Buy on Newegg | |
|---|---|---|
| TDP | 250W | — |
| VRAM | 16 GB | 20 GB |
| Length | 298 mm | 276 mm |
| Chipset | Radeon RX 9070 XT | Radeon RX 7900 XT |
| Video Outputs | HDMI 2.1, DisplayPort 2.1 | HDMI 2.1, DisplayPort 2.1 |
| VRAM Type | GDDR6 | GDDR6 |
| Base Clock | 2400 MHz | 2000 MHz |
| Slot Width | 3 | 3 |
| Boost Clock | 2970 MHz | 2400 MHz |
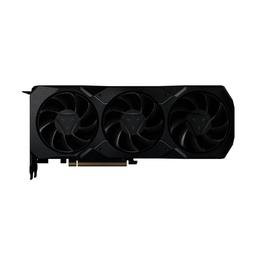
1 listed spec looks implausible for this part and is hidden and not scored.
Spec sheets: too close to call
ASRock Steel Legend Radeon RX 9070 XT
3
spec-sheet points
XFX RX-79TMBABF9 Radeon RX 7900 XT
3
spec-sheet points
Spec-sheet points weight the specs that matter most in this category (not a raw count of specs won). The badge above follows the estimated gaming performance below.
Estimated Gaming Performance: RX 9070 XT vs RX 7900 XT
The RX 9070 XT averages 147 FPS to the RX 7900 XT's 133 (+11%) across 50 games and is faster in 50 of them.
| Game | Resolution | RX 9070 XT FPS | RX 7900 XT FPS | Winner |
|---|---|---|---|---|
| Counter-Strike 2 | 1440p | 386 | 350 | RX 9070 XT+10% |
| Rainbow Six Siege | 1440p | 353 | 319 | RX 9070 XT+11% |
| Valorant | 1440p | 319 | 289 | RX 9070 XT+10% |
| League of Legends | 1440p | 319 | 289 | RX 9070 XT+10% |
| Overwatch 2 | 1440p | 252 | 228 | RX 9070 XT+11% |
| Apex Legends | 1440p | 244 | 220 | RX 9070 XT+11% |
| EA Sports FC 25 | 1440p | 235 | 213 | RX 9070 XT+10% |
| DOTA 2 | 1440p | 235 | 213 | RX 9070 XT+10% |
| Warframe | 1440p | 227 | 205 | RX 9070 XT+11% |
| PUBG: Battlegrounds | 1440p | 218 | 198 | RX 9070 XT+10% |
| Destiny 2 | 1440p | 202 | 182 | RX 9070 XT+11% |
| NBA 2K25 | 1440p | 193 | 175 | RX 9070 XT+10% |
| Delta Force | 1440p | 164 | 148 | RX 9070 XT+11% |
| Grand Theft Auto V | 1440p | 160 | 144 | RX 9070 XT+11% |
| Marvel Rivals | 1440p | 160 | 144 | RX 9070 XT+11% |
| Diablo IV | 1440p | 160 | 144 | RX 9070 XT+11% |
| Fortnite | 1440p | 151 | 137 | RX 9070 XT+10% |
| Ghost of Tsushima | 1440p | 143 | 129 | RX 9070 XT+11% |
| The Witcher 3 | 1440p | 139 | 125 | RX 9070 XT+11% |
| Baldur's Gate 3 | 1440p | 139 | 125 | RX 9070 XT+11% |
| Call of Duty: Warzone | 1440p | 139 | 125 | RX 9070 XT+11% |
| Spider-Man Remastered | 1440p | 139 | 125 | RX 9070 XT+11% |
| Rust | 1440p | 134 | 122 | RX 9070 XT+10% |
| Path of Exile 2 | 1440p | 134 | 122 | RX 9070 XT+10% |
| God of War Ragnarök | 1440p | 134 | 122 | RX 9070 XT+10% |
| The Last of Us Part II | 1440p | 126 | 114 | RX 9070 XT+11% |
| Palworld | 1440p | 126 | 114 | RX 9070 XT+11% |
| Cyberpunk 2077 | 1440p | 122 | 110 | RX 9070 XT+11% |
| Red Dead Redemption 2 | 1440p | 118 | 106 | RX 9070 XT+11% |
| Helldivers 2 | 1440p | 118 | 106 | RX 9070 XT+11% |
| Horizon Forbidden West | 1440p | 113 | 103 | RX 9070 XT+10% |
| Escape from Tarkov | 1440p | 109 | 99 | RX 9070 XT+10% |
| Hogwarts Legacy | 1440p | 109 | 99 | RX 9070 XT+10% |
| Kingdom Come: Deliverance 2 | 1440p | 109 | 99 | RX 9070 XT+10% |
| Warhammer 40,000: Space Marine 2 | 1440p | 109 | 99 | RX 9070 XT+10% |
| Final Fantasy VII Rebirth | 1440p | 101 | 91 | RX 9070 XT+11% |
| Dragon Age: The Veilguard | 1440p | 101 | 91 | RX 9070 XT+11% |
| Indiana Jones and the Great Circle | 1440p | 97 | 87 | RX 9070 XT+11% |
| Starfield | 1440p | 80 | 72 | RX 9070 XT+11% |
| Monster Hunter Wilds | 1440p | 80 | 72 | RX 9070 XT+11% |
| Dragon's Dogma 2 | 1440p | 76 | 68 | RX 9070 XT+12% |
| Microsoft Flight Simulator 2024 | 1440p | 71 | 65 | RX 9070 XT+9% |
| Silent Hill 2 | 1440p | 71 | 65 | RX 9070 XT+9% |
| Star Wars Outlaws | 1440p | 71 | 65 | RX 9070 XT+9% |
| Assassin's Creed Shadows | 1440p | 67 | 61 | RX 9070 XT+10% |
| S.T.A.L.K.E.R. 2 | 1440p | 66 | 59 | RX 9070 XT+12% |
| Alan Wake 2 | 1440p | 63 | 57 | RX 9070 XT+11% |
| Black Myth: Wukong | 1440p | 50 | 46 | RX 9070 XT+9% |
| Genshin Impact | 1440p | 50 | 46 | RX 9070 XT+9% |
| Elden Ring | 1440p | 50 | 46 | RX 9070 XT+9% |
FPS figures are estimates from published review benchmarks; cards a review did not cover are scaled by relative performance. PlanMyPC does not run its own benchmarks. Each figure is for the listed resolution, and games where the two cards are within 3% of each other are marked as a tie. Actual performance varies with CPU, settings, and driver version.
Compare more parts
Add a third or fourth video card to this comparison, or build a side-by-side from scratch in the interactive compare tool.