MSI INSPIRE 3X OC GeForce RTX 5080 vs MSI VENTUS 2X GeForce RTX 4070 Ti SUPER
A side-by-side spec comparison of the MSI INSPIRE 3X OC GeForce RTX 5080 and the MSI VENTUS 2X GeForce RTX 4070 Ti SUPER. We line up every specification and score the ones that matter most in this category — weighted, not a raw count of specs won — to reach an overall verdict so you can decide which video card is right for your build.
As an Amazon Associate, PlanMyPC earns from qualifying purchases. We may also earn from other stores linked here. How we make money
| Specification | ||
|---|---|---|
| TDP | 320W | 285W |
| VRAM | 16 GB | 16 GB |
| Length | 288 mm | 242 mm |
| Chipset | GeForce RTX 5080 | GeForce RTX 4070 Ti SUPER |
| Video Outputs | HDMI 2.1, DisplayPort 2.1 | HDMI 2.1, DisplayPort 2.1 |
| VRAM Type | GDDR7 | GDDR6X |
| Base Clock | 2300 MHz | 2340 MHz |
| Slot Width | 3 | 3 |
| Boost Clock | 2655 MHz | 2625 MHz |
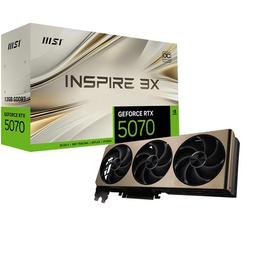

Spec-sheet points: MSI INSPIRE 3X OC GeForce RTX 5080 leads — driven by Boost Clock (2655 MHz), VRAM Type (GDDR7)
MSI INSPIRE 3X OC GeForce RTX 5080
4
spec-sheet points
MSI VENTUS 2X GeForce RTX 4070 Ti SUPER
1
spec-sheet point
Spec-sheet points weight the specs that matter most in this category (not a raw count of specs won). The badge above follows the estimated gaming performance below.
Estimated Gaming Performance: RTX 5080 vs RTX 4070 Ti SUPER
The RTX 5080 averages 158 FPS to the RTX 4070 Ti SUPER's 150 (+5%) across 5 games and is faster in 4 of them.
| Game | Resolution | RTX 5080 FPS | RTX 4070 Ti SUPER FPS | Winner |
|---|---|---|---|---|
| Valorant | 1440p | 350 | 450 | RTX 4070 Ti SUPER+29% |
| Cyberpunk 2077 | 1440p | 133 | 78 | RTX 5080+71% |
| Hogwarts Legacy | 1440p | 120 | 95 | RTX 5080+26% |
| Baldur's Gate 3 | 4K | 101 | 55 | RTX 5080+84% |
| Starfield | 1440p | 87 | 72 | RTX 5080+21% |
FPS figures are estimates from published review benchmarks; cards a review did not cover are scaled by relative performance. PlanMyPC does not run its own benchmarks. Each figure is for the listed resolution, and games where the two cards are within 3% of each other are marked as a tie. Actual performance varies with CPU, settings, and driver version.
Compare more parts
Add a third or fourth video card to this comparison, or build a side-by-side from scratch in the interactive compare tool.