MSI SUPRIM SOC GeForce RTX 5080 vs MSI SUPRIM X GeForce RTX 4080 SUPER
A side-by-side spec comparison of the MSI SUPRIM SOC GeForce RTX 5080 and the MSI SUPRIM X GeForce RTX 4080 SUPER. We line up every specification and score the ones that matter most in this category — weighted, not a raw count of specs won — to reach an overall verdict so you can decide which video card is right for your build.
| Specification | ||
|---|---|---|
| TDP | 320W | 320W |
| VRAM | 16 GB | 16 GB |
| Length | 359 mm | 336 mm |
| Chipset | GeForce RTX 5080 | GeForce RTX 4080 SUPER |
| Video Outputs | HDMI 2.1, DisplayPort 2.1 | HDMI 2.1, DisplayPort 2.1 |
| VRAM Type | GDDR7 | GDDR6X |
| Base Clock | 2300 MHz | 2210 MHz |
| Slot Width | 3 | 3 |
| Boost Clock | 2300 MHz | 2655 MHz |
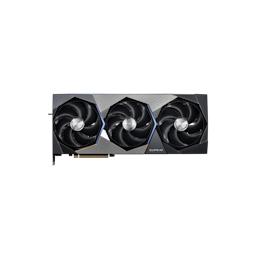
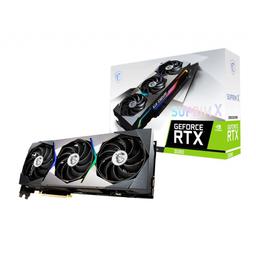
Winner: MSI SUPRIM X GeForce RTX 4080 SUPER — driven by Boost Clock (2655 MHz)
MSI SUPRIM SOC GeForce RTX 5080
1
performance point
MSI SUPRIM X GeForce RTX 4080 SUPER
3
performance points
Winner is scored by weighting the specs that matter most in this category (not a raw count of specs won).
As an Amazon Associate, PlanMyPC earns from qualifying purchases made through links on this page.
Real Gaming Performance: RTX 5080 vs RTX 4080 SUPER
We compared real benchmark frame rates for the RTX 5080 and RTX 4080 SUPER across 3 games. The RTX 5080 comes out ahead, winning 3 of 3 games with an average of 123 FPS versus 87 FPS.
| Game | Resolution | RTX 5080 FPS | RTX 4080 SUPER FPS | Winner |
|---|---|---|---|---|
| Baldur's Gate 3 | 1440p | 152 | 98 | RTX 5080+55% |
| Cyberpunk 2077 | 1440p | 133 | 105 | RTX 5080+27% |
| Red Dead Redemption 2 | 4K | 83 | 58 | RTX 5080+43% |
Frame rates are averages from community-submitted benchmarks at the listed resolution. Actual performance varies with CPU, settings, and driver version.
Compare more parts
Add a third or fourth video card to this comparison, or build a side-by-side from scratch in the interactive compare tool.