To tell if your CPU is bottlenecking your GPU, turn off any frame cap and V-Sync, then lower the resolution or pick a more aggressive upscaling preset. If your frame rate barely rises, the CPU is the limit; if it jumps, the GPU is. Every PC has a bottleneck, and in a gaming PC you want it on the GPU.
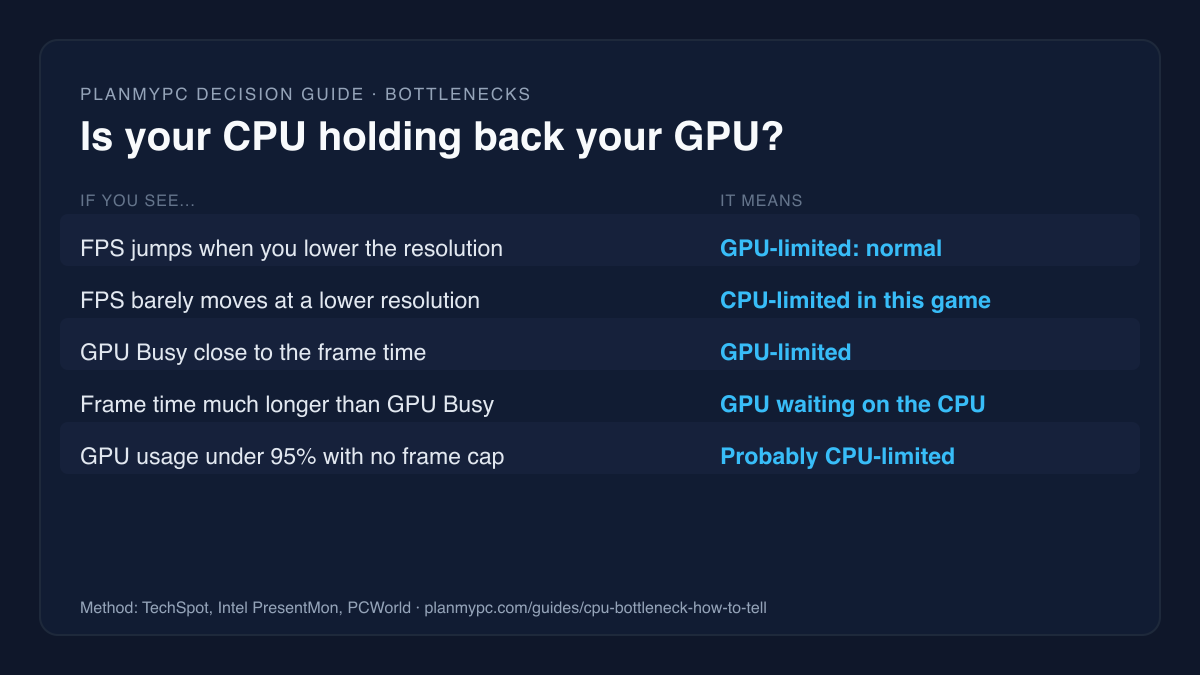
Signs of a CPU bottleneck
A CPU bottleneck means the graphics card sits partly idle, waiting for the processor to prepare the next frame. These are the usual signs:
| What you see | What it usually means | Next step |
|---|---|---|
| FPS jumps when you lower the resolution | GPU-limited, the normal state | Nothing to fix; tune settings |
| FPS barely changes at a lower resolution | CPU-limited in this game | Compare CPUs |
| GPU usage well below 95% with no frame cap | Probably CPU-limited | Run the resolution test below |
| Stutter in busy scenes, smooth elsewhere | Often a CPU-heavy moment; can also be VRAM overflow or shader compilation | Check GPU Busy in that scene; see how much VRAM you need |
| Low FPS everywhere, GPU at 99% | GPU-limited | Pick a faster GPU |
Who should worry, and who shouldn't
It is worth checking if you:
- just bought a much faster graphics card for an older CPU;
- play simulation, strategy or large multiplayer games, or chase very high frame rates on a high-refresh monitor;
- see frame rates that do not change when you change graphics settings.
You can ignore it if you:
- play at 1440p or 4K and your GPU usage sits near 99% (the best GPUs for 1440p show what a faster card would add);
- run a frame cap or V-Sync and hit it consistently (the game FPS estimator shows whether a higher cap is in reach);
- read a "bottleneck percentage" from a website and nothing feels wrong in your games (see why those numbers mislead).
How do I test for a CPU bottleneck?
Reviewers use the same lever. TechSpot tests CPUs at 1080p with the most powerful graphics card available, because a low resolution "helps to alleviate the potential for GPU bottlenecks" and exposes the CPU's limit (TechSpot). You can use the same lever on your own PC:
- Pick a repeatable spot in the game you care about: the same route, scene or replay.
- Turn off any frame cap and V-Sync for the test.
- Note your average frame rate at your normal settings.
- Drop the resolution, or set the upscaler to its Performance preset, and run the same spot again.
- If the frame rate rose a lot, the GPU was the limit. If it barely moved, the CPU was.
PCWorld suggests the same lever as a fix for a GPU-limited PC: lower settings, then "try lowering your resolution" (PCWorld).
Read GPU Busy for a precise answer
GPU usage percentages are rough. Intel's free PresentMon tool reports a better metric, GPU Busy: how long the graphics card was actually working on each frame (PresentMon documentation). Intel's Graphics Performance Analyzers guide describes the same idea as a percentage: for a GPU-bound workload "the value of the GPU Busy metric is 100%", and below that the GPU may be idle, "waiting for data from the CPU" (Intel).
How to read it:
- GPU Busy close to the frame time: the GPU is working the whole frame, so it is the limit.
- Frame time clearly longer than GPU Busy: the GPU spent part of each frame waiting, so the CPU (or the game engine) is the limit.
Intel describes GPU Busy as showing "real time CPU + GPU balance" (Intel PresentMon). NVIDIA's FrameView and the free CapFrameX are built on PresentMon too, if you prefer their overlays.
What GPU usage means a CPU bottleneck?
To see GPU usage while you play, use an in-game overlay: the NVIDIA app and AMD Software both have one, as do MSI Afterburner and the PresentMon-based tools above. Windows Task Manager's Performance tab shows it too, which is easiest to read on a second screen.
PCWorld treats GPU usage below about 95% as the sign of a CPU bottleneck, and says "you can tell you're encountering a CPU bottleneck when your GPU isn't fully utilized" (PCWorld). It is a useful rule, with three traps:
- A frame cap or V-Sync lowers GPU usage on purpose. Hitting your cap is not a bottleneck.
- Menus, loading screens and pauses are not gameplay. Read the number while playing.
- Averages hide spikes. A game can show 97% usage overall and still stutter in one CPU-heavy area.
Why CPU usage can look low when the CPU is the limit
A common misreading: "my CPU is only at 40%, so it can't be the bottleneck." Task Manager's CPU figure is an average across every core. Many games do most of their frame preparation on one or two busy threads, so those threads can be maxed out while the average looks modest. A tool that shows per-core load, such as HWiNFO, makes that visible: one or two cores pinned near 100% during the stutter is the tell. PresentMon's CPU Busy and CPU Wait figures, which measure how long the CPU spent on each frame and how long it waited before starting the next (PresentMon documentation), are a better guide than the overall percentage. The resolution test above gives the plain answer either way.
Which games lean on the CPU
A bottleneck belongs to a game and a scene, not to a part. Reviewers keep naming the same kinds of game:
- Baldur's Gate 3: Gamers Nexus' review shows the Ryzen 7 9800X3D averaging 160 FPS against 105 FPS for the Core i9-14900K, a gap only a CPU-limited game produces (Gamers Nexus).
- Dragon's Dogma 2 is, in Gamers Nexus' words, "still heavy on CPUs" even after its performance patches.
- Starfield is PCWorld's example of a CPU-heavy game, while it notes Counter-Strike 2 uses a lot less of the CPU (PCWorld).
- Microsoft Flight Simulator is NVIDIA's own example of a CPU-bound game (NVIDIA).
Not every game splits the field. In the same Gamers Nexus review, Total War: Warhammer 3 bunched the CPUs together because the GPU was the limit. Per-game estimates for your exact CPU and GPU pair are on the game FPS estimator, and per-game GPU pages such as Baldur's Gate 3 and Starfield show how far each card goes.
Why bottleneck calculators mislead
Bottleneck calculator sites give one percentage for a CPU and GPU pair. PCWorld's criticism is that they "only make bare-bones calculations about performance", while the real workload "will vary significantly according to the game you're playing" and the resolution (PCWorld).
The planner's own bottleneck panel works on the same principle: it compares a performance score for the CPU with one for the GPU, at three resolutions. That is useful for one job, spotting a badly mismatched pair before you buy, such as a high-end card on an old six-core chip. It cannot know your game, your settings or your frame cap. Use it as a first filter, then run the resolution test above in the games you actually play.
Can frame generation fix a CPU bottleneck?
It raises the frame rate you see, but not how quickly the game responds.
- NVIDIA says frame generation "executes as a post-process on the GPU" and can "boost frame rates even when the game is bottlenecked by the CPU" (NVIDIA). Multi Frame Generation on RTX 50 cards adds several generated frames for each rendered one, up to three in DLSS 4 as NVIDIA announced it in January 2025 (NVIDIA).
- AMD says its frame generation "works in both GPU and CPU-limited situations", runs best from at least 60 FPS before generation, and that below 30 FPS it "should be absolutely avoided" (AMD GPUOpen).
NVIDIA pairs its frame generation with Reflex "for optimal responsiveness" (NVIDIA). The other catch follows from how it works, and is our reading rather than a vendor statement: generated frames are inserted between frames the game actually rendered, so the game still reads your input and updates the world at the CPU-limited rate. Frame generation makes a smooth-enough game look smoother. It does not rescue one that is struggling.
How to fix a real CPU bottleneck
Before you spend money:
- Use the headroom. If the GPU is idle, raise the resolution, render scale or graphics settings. You get a better image at almost no cost in frame rate.
- Lower the settings that add simulation work, not pixels. Crowd or population density, view distance and physics detail tend to load the CPU; resolution and texture settings barely touch it.
- Check memory. Two sticks in dual channel, enough capacity, and the EXPO or XMP profile switched on in the BIOS all matter; our RAM guide covers each.
- Check CPU temperatures. A CPU that overheats lowers its own clocks, which looks just like a bottleneck. Watch the temperature in the same overlay while the game runs.
- Cap the frame rate a little below what the CPU can hold. A steady cap feels better than an uncapped number that swings.
If the resolution test still points at the CPU, upgrade it, and check first whether that means one part or three. A drop-in chip on the same socket is a CPU swap; a move to a newer socket also means a new motherboard and often new memory, which changes the budget. For CPU-heavy games, chips with 3D V-Cache are the usual answer. See the best CPUs for gaming, and if you are on AM4, AM4 vs AM5 explains when a drop-in chip beats a new platform. The upgrade planner compares options against your current parts.
Worked example: read the planner's bottleneck panel
- Open this example build with a Ryzen 7 9800X3D and a Radeon RX 9070.
- Scroll to the bottleneck panel. On Nov 5, 2026 its badge read "GPU sets the pace". It rated this pair GPU-limited at 1080p, 1440p and 4K, with the graphics card fully busy at each, and said: "Your graphics card sets the frame rate at every resolution. That is normal for a gaming PC: the graphics card does most of the work in games." It suggested no upgrade.
- That matches this guide: a GPU-limited gaming PC is normal, and the 9800X3D's spare capacity is headroom for CPU-heavy scenes. Upgrade the graphics card only if the frame rate itself is too low for you.
- Remember what the panel is: a comparison of the two parts in general. It cannot see your game, resolution or frame cap, so it cannot replace the resolution test.
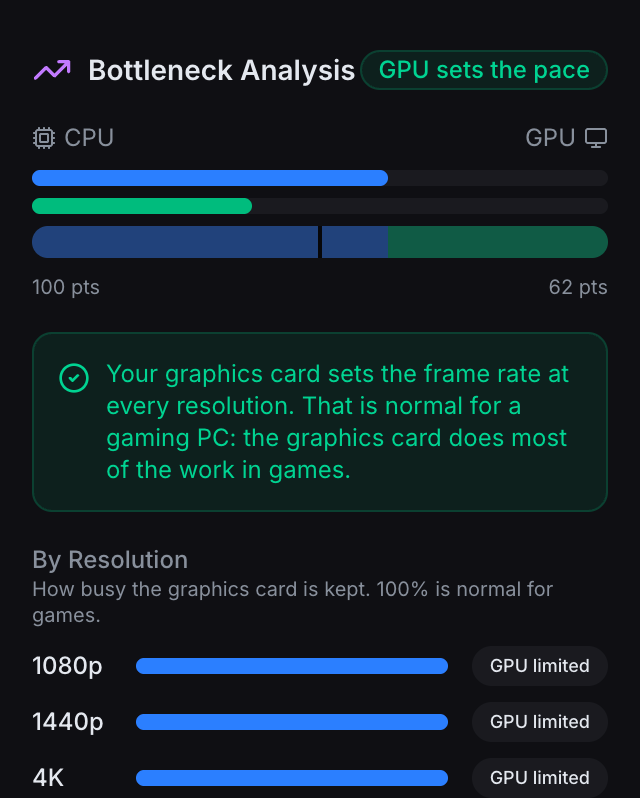
The planner's bottleneck panel for the example build on Nov 5, 2026. It compares general performance scores for the two parts; it is not a measurement of any game.
Sources
- TechSpot, "How We Test: CPU Benchmarks, Misconceptions Explained", Steven Walton, Feb 2, 2023: why CPU tests use 1080p and the fastest GPU. Accessed Oct 27, 2026.
- Intel, GPU Metrics (Graphics Performance Analyzers user guide), PresentMon console documentation and Intel PresentMon: GPU Busy and frame time definitions. Accessed Oct 27, 2026.
- NVIDIA FrameView and CapFrameX: PresentMon-based tools. Accessed Oct 27, 2026.
- PCWorld, "PC bottlenecks explained", Jun 28, 2023 (the 95% GPU usage line, lowering resolution), and PCWorld, "Why I never use a bottleneck calculator", Apr 25, 2025 (calculator limits, Starfield vs Counter-Strike 2). Accessed Oct 27, 2026.
- Gamers Nexus, Ryzen 7 9800X3D review, Nov 7, 2024: Baldur's Gate 3, Dragon's Dogma 2, Total War: Warhammer 3. Accessed Oct 27, 2026.
- NVIDIA, DLSS 3 announcement, Sep 20, 2022, and DLSS 4 Multi Frame Generation, Jan 6, 2025; AMD GPUOpen, FSR 3: frame generation and CPU limits. Accessed Oct 27, 2026.